Original Link: https://www.anandtech.com/show/2101
Intel Core 2 Chipset Power Consumption Shootout
by Anand Lal Shimpi on October 12, 2006 12:53 PM EST- Posted in
- CPUs
Since the introduction of Intel's 90nm Prescott core, power consumption has been at the forefront of any CPU related discussion. But as both AMD and Intel strive towards introducing more power efficient cores we must turn our attention elsewhere to find new areas where power savings are necessary. The GPU is next on the chopping block for power consumption, but we've still got a little time before both ATI and NVIDIA unveil their new high DirectX 10 parts fully equipped with very high power consumption. While we wait for the next-generation of powerful GPUs and quad-core CPUs to debut, we decided to take a look at the power consumption of an often overlooked component in the system: the chipset.
Dutifully playing its role as traffic cop in any modern system, the chipset has to deal with getting data from each and every high speed, high powered component in the system and directing it to the right place. Thankfully the amount of logic in a chipset is nothing near that of a CPU, but given its role in a high performance system, the chipset can easily be a notable consumer of power. The question is - are some chipsets better than others for power consumption?
There have been obvious examples in the past where chipsets varied dramatically in power consumption, like ATI's CrossFire 3200 chipset vs. NVIDIA's nForce 590 SLI, the latter of which consumed significantly more power. But what about more mainstream offerings, and in particular, mainstream chipsets that support Intel's Core 2 processors - is there a noticeable difference in performance, power consumption and overall performance per watt between them?
We're asking this question now because it is inevitably the first question we need answered before we can start doing (as close to) apples-to-apples comparisons between CPUs with regards to power consumption. We chose to start with Core 2 platforms since that's the hot topic these days and power consumption/performance per watt is a very compelling reason to consider Intel's Core 2 line of processors.
The Platforms
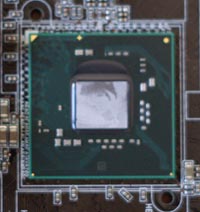
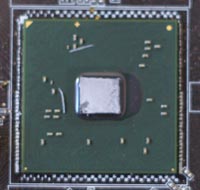
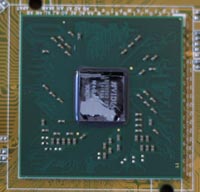
We picked the three most popular mainstream Core 2 chipsets currently available for this comparison: Intel's P965, Intel's 975X and NVIDIA's nForce 570 SLI Intel Edition.
Intel P965 |
Intel 975X |
 |
 |
NVIDIA nForce 570 SLI |
|
 |
|
We will eventually add Intel's G965 to the mix but we'll save analysis of that chipset for our full review of the new integrated graphics core. These three chipsets represent the performance mainstream offerings any Core 2 purchaser would consider and a good starting point for these sorts of comparisons. Obviously there are other chipsets that we are interested to look at, for example VIA's PT880 and Intel's 945G, but we will have to save those for a later date in the interest of time.
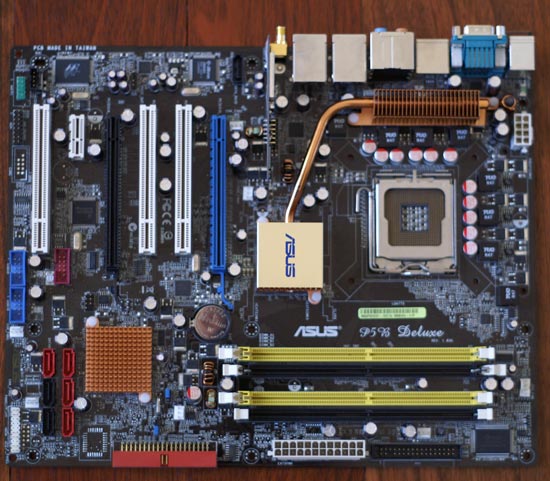
As luck would have it, ASUS makes a motherboard based on all three chipsets we're interested in comparing today and thus we used all ASUS platforms for today's article.
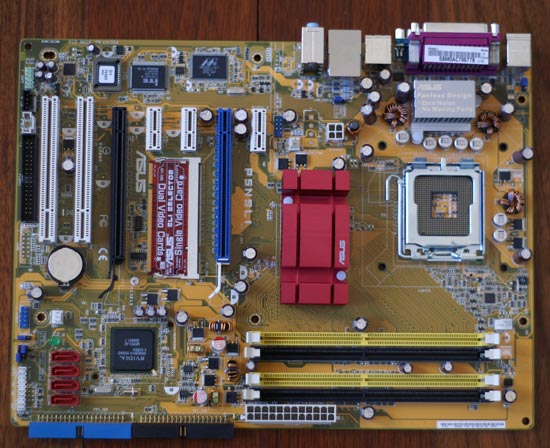
Representing the Intel P965 chipset we have ASUS' P5B Deluxe:
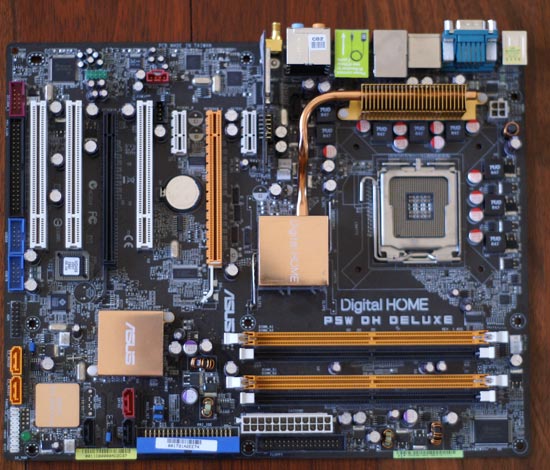
The ASUS P5W DH Deluxe, one of our first Core 2 motherboards, features Intel's 975X chipset:
And finally we have ASUS' P5NSLI, a very affordable nForce 570 SLI solution:
Note that today's comparison is merely one aspect of comparing these three platforms; things like price, I/O, and networking performance as well as multi-GPU support are all important considerations that go beyond the scope of this article. Our concern today is power consumption and thus that's what we will focus on.
The Test
We did our best to make this a chipset power consumption comparison, but in reality it is just as much of a motherboard power consumption shootout as a chipset one. All extra features -- things like Wireless LAN and IEEE-1394 support -- were disabled to level the playing field as much as possible between platforms. All memory timings and BIOS settings (where applicable) were set identically across all three systems, and of course we used the same physical CPU, power supply, memory and video card for each system to avoid any variation between components.
Our testing methodology was simple: we ran through our usual suite of CPU performance tests, varying only the motherboard, but also recorded power consumption for the duration of each benchmark (beginning when the benchmark starts measuring performance and concluding when it is done measuring performance). Using an Extech 380803 Power Analyzer we were able to log the instantaneous power consumption of our test systems every half a second, giving us reasonable accuracy, especially for the longer tests. For each benchmark that we ran, we plotted performance, total system power consumption and performance per watt.
We were able to run almost all of our tests while measuring power consumption with the exception of PC WorldBench 5, the reason being that some of the WorldBench tests were too short to get accurate power measurements with. We are working on a solution and hope to present WorldBench power consumption numbers in future articles.
| CPU: | Intel Core 2 Duo E6700 (2.66GHz/4MB) |
| Motherboard: | ASUS P5W DH Deluxe (975X) ASUS P5B Deluxe (P965) ASUS P5NSLI (nForce 570 SLI) |
| Chipset: | Intel 975X Intel P965 NVIDIA nForce 570 SLI |
| Chipset Drivers: | NVIDIA 8.22 Intel 8.1.1.1001 |
| Hard Disk: | Seagate 7200.9 300GB SATA |
| Memory: | Corsair XMS2 DDR2-800 4-4-4-12 (1GB x 2) |
| Video Card: | XFX GeForce 7900 GS |
| Video Drivers: | NVIDIA ForceWare 91.47 |
| Desktop Resolution: | 1280 x 1024 - 32-bit @ 60Hz |
| OS: | Windows XP Professional SP2 |
Application Performance & Power Usage with SYSMark 2004
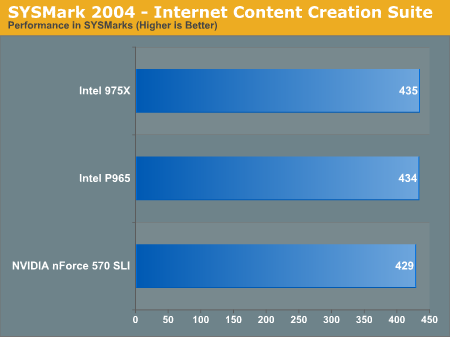
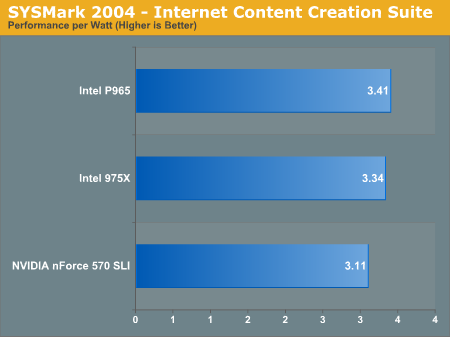
We start out with SYSMark 2004's Internet Content Creation suite, and from a performance standpoint all three chipsets perform within the margin of error for this benchmark:
Power consumption however is a far more interesting graph than performance, as there is a clear difference between the three chipsets. Intel's P965 comes out on top (in a good way), with the system drawing an average of 127.1W, followed by the 975X with a 2.5% increase in power usage and finally NVIDIA's nForce 570 SLI at 138.1W. While the difference between the P965 and 975X isn't too great, NVIDIA's nForce 570 SLI draws an average of 11W more than the P965, or 8.6%.
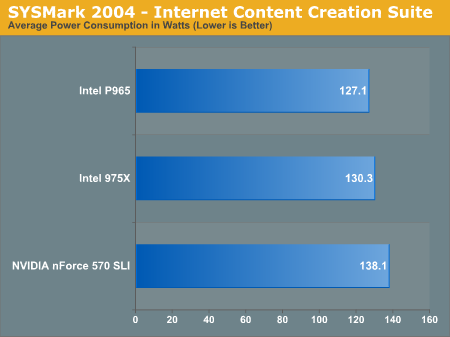
Given that all three platforms perform the same, the performance per watt graph isn't very alarming - the lowest power consumer gets the best performance per watt.
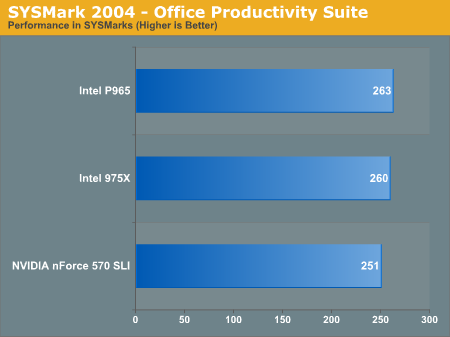
The Office Productivity suite in SYSMark 2004 has the nForce 570 SLI slightly underperforming, with the P965 weighing in about 4.5% faster, but still nothing significant.
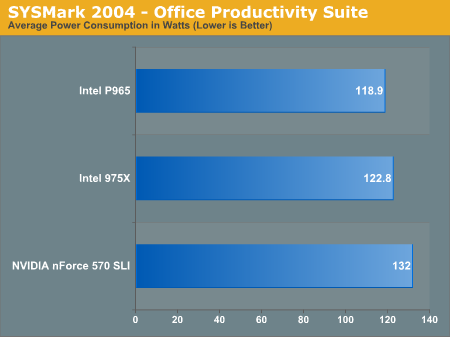
Once again, it's the power consumption charts that are the most interesting; with a lighter CPU load, the power consumption of the platform manages to stand out more and here the nForce 570 SLI uses 11% more power than the Intel P965.
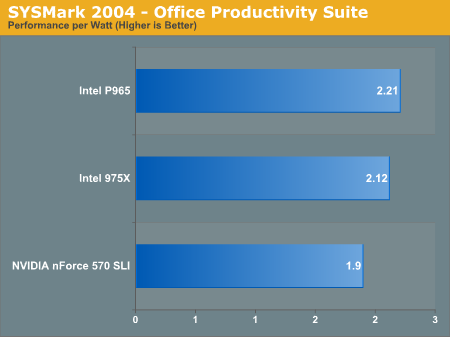
Performance being virtually equal, the performance per watt graph tells us exactly what we expected to see:
Application Performance & Power Usage with Winstone 2004
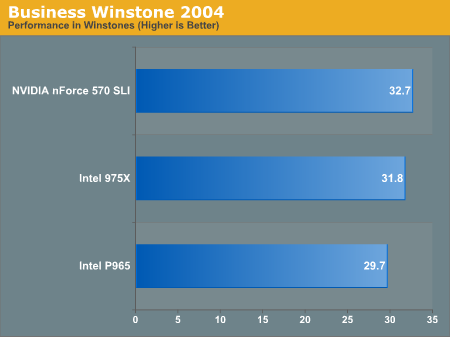
Business Winstone 2004 is the first time we actually see a real performance difference, with the nForce 570 SLI ending up on top, outperforming Intel's P965 by a full 10%. With an actual performance difference, this could make the performance per watt comparison quite interesting.
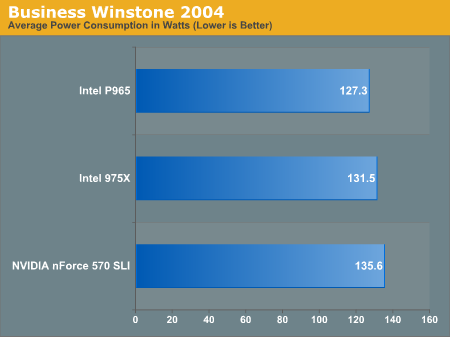
Power consumption is following the same pattern we've already seen: P965 at the top, followed by 975X and then in last place, the nForce 570 SLI. The margins are a lot closer here, with the NVIDIA platform drawing only 6.5% more power than the P965 on average, but it's still measurable.
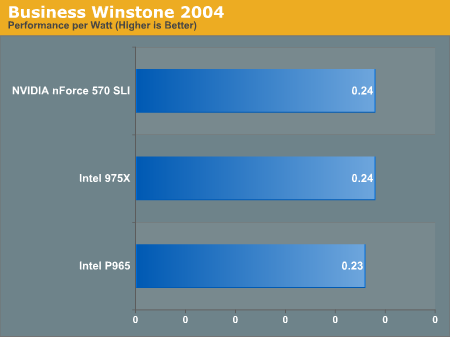
Looking at performance per watt, the high performance of the nForce 570 SLI balances out its high power consumption to equal the Intel 975X and slightly outpace the P965.
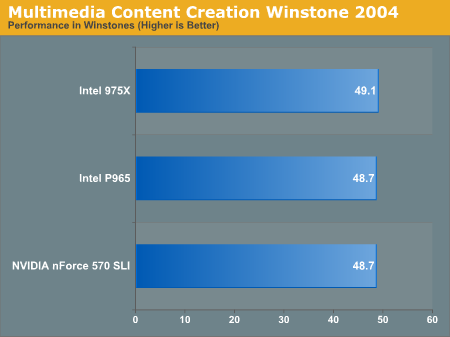
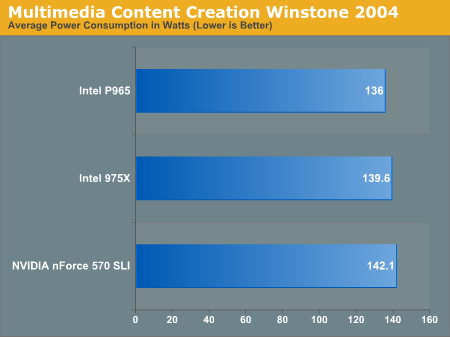
Things go back to normal though in the Multimedia Content Creation Winstone 2004 test, with all three platforms basically performing the same.
Given that MMCC Winstone 2004 is a more CPU bound test than Business, it's not a surprise to see a narrower gap in power consumption, with the NVIDIA platform only drawing 4.4% more power than the Intel solution.
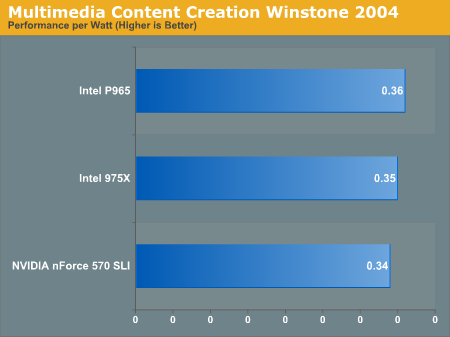
With equal performers, the lowest power consumer ends up having the best performance per watt.
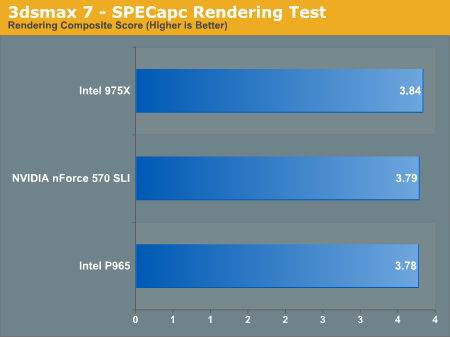
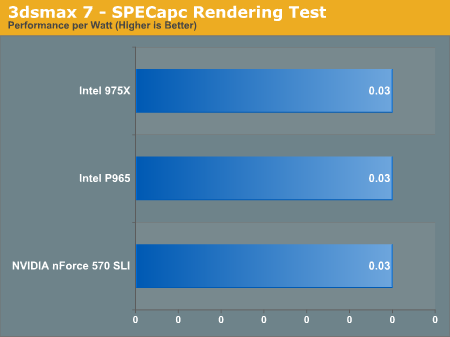
3D Rendering Performance & Power Usage
With a 1% difference in performance between the 975X and the nForce 570 SLI, we can consider these platforms equal once again as far as performance, but what about power consumption?
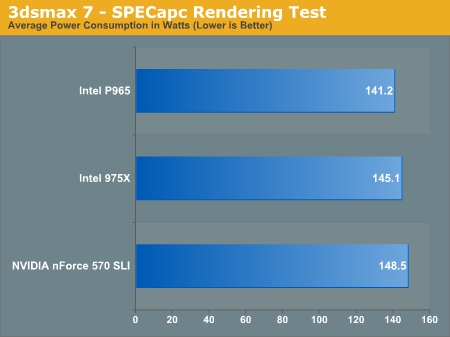
Couple a heavy CPU load with light memory and I/O traffic and once again we see that there's only around a 5% difference in power consumption between the P965 and the nForce 570 SLI.
Performance per watt ends up being tied between all of the offerings:
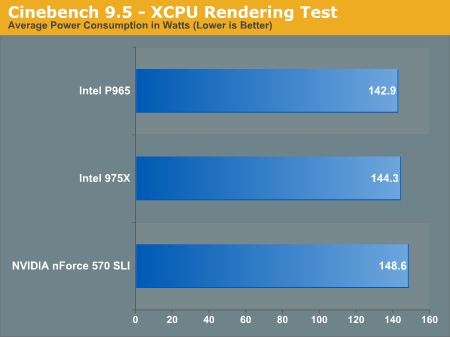
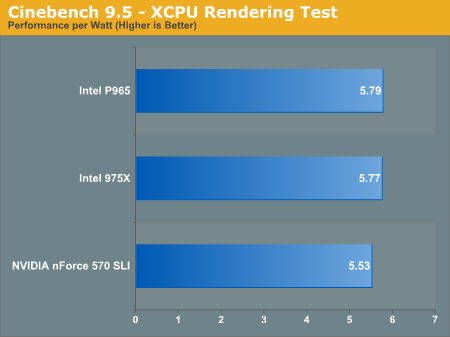
The situation is really no different under Cinebench 9.5, with performance being equal across the board.
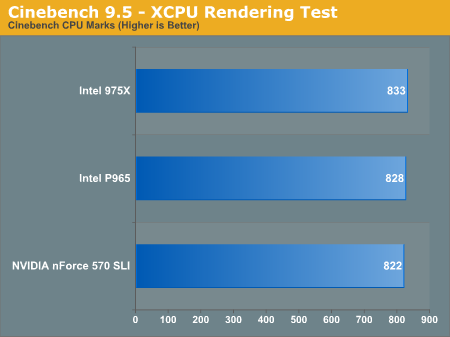
Power consumption continues to be higher on the NVIDIA platform, but here by less than 4%.
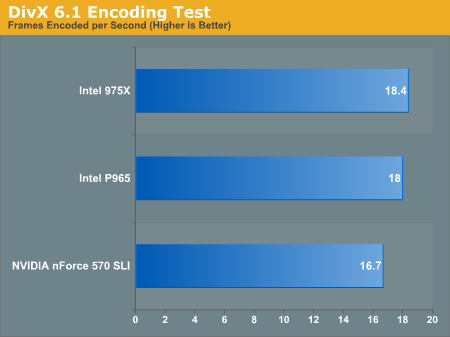
Encoding Performance & Power Usage with DivX/WME9
In our DivX encoding test there's about a 10% gap between the Intel 975X and NVIDIA's nForce 570 SLI, with the P965 falling in line closer to its older brother than NVIDIA's offering.
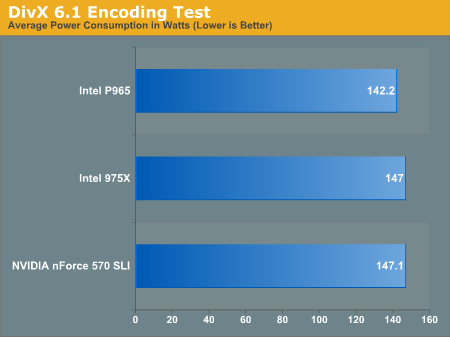
Power consumption is as expected, with the P965 consuming the least and the nForce 570 SLI consuming the most.
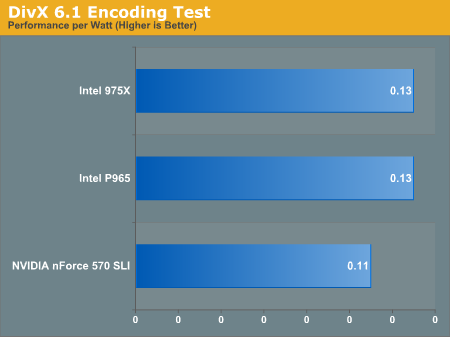
The performance per watt chart has the 975X and P965 tied, thanks to the 975X's higher performance. And given the nForce 570 SLI's lower performance and higher power consumption, it falls to the bottom of the chart.
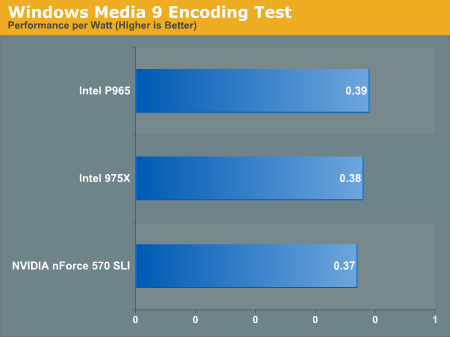
Windows Media Encoding has all three platforms equal in performance:
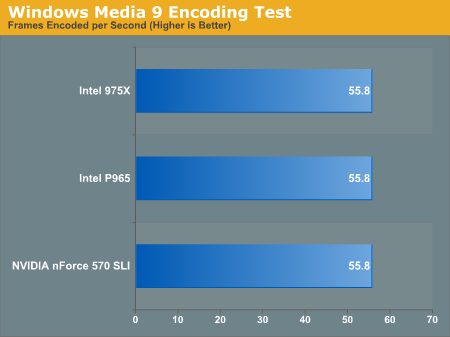
...and power consumption is very similar to our DivX test:

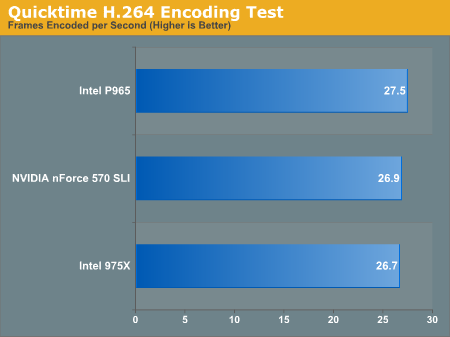
Encoding Performance & Power Usage with Quicktime/iTunes
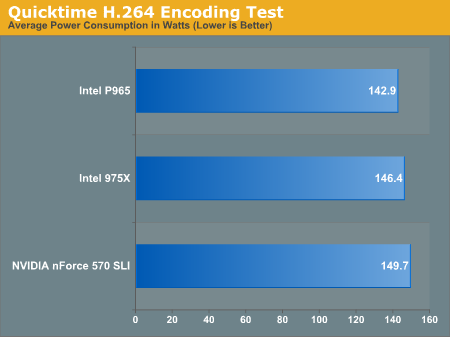
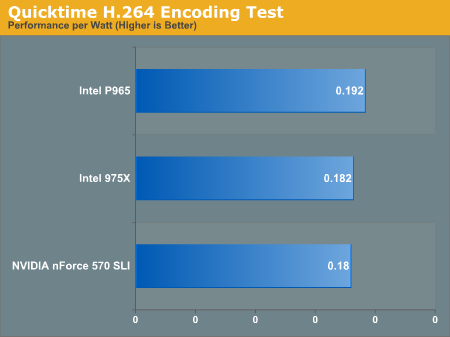
In our Quicktime encoding test, performance is fairly close between all three platforms, once again making it boil down to power consumption.
...which obviously favors Intel's P965, as the nForce 570 SLI draws just under 5% more power than the P965.
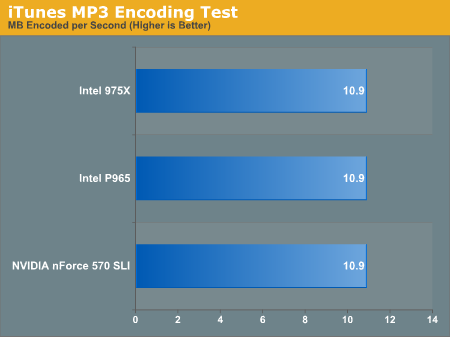
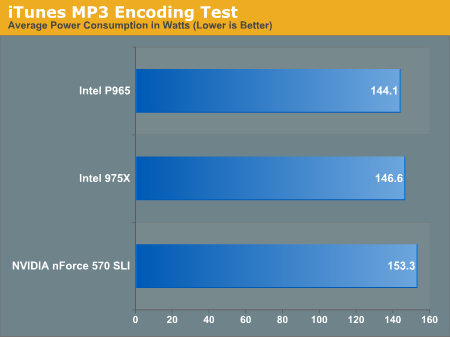
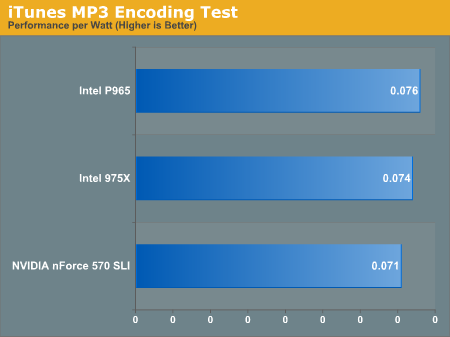
Rounding off our look at encoding performance/power consumption is our iTunes MP3 encode test, and the standings don't change here either:
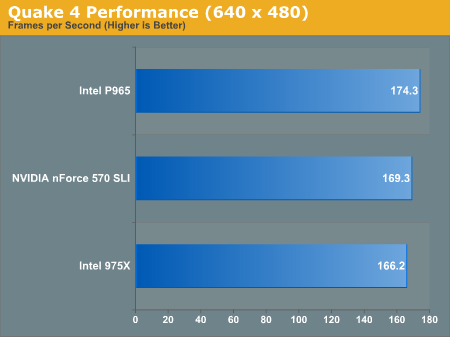
Gaming Performance & Power Usage with Quake 4
At 640 x 480, we're not GPU bound at all so power consumption isn't nearly as high as it could be, but performance is. In theory this configuration should be stressing the chipset more than anything when it comes to power usage.
The P965 continues to be the lower power solution, with the nForce 570 SLI drawing over 6% more power on average during the course of the benchmark.

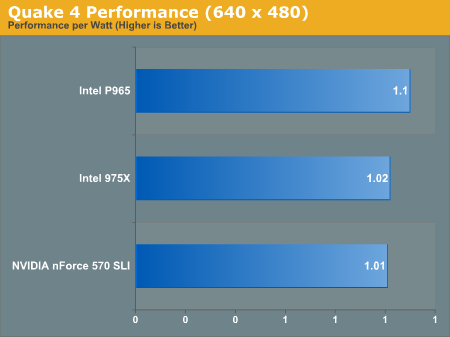
Obviously the winner of the performance per watt test is the P965, by a reasonable margin thanks to its higher performance and lower power consumption. But what happens if we crank up the resolution to a more GPU-bound setting? Will the differences in chipset power consumption get larger or smaller?
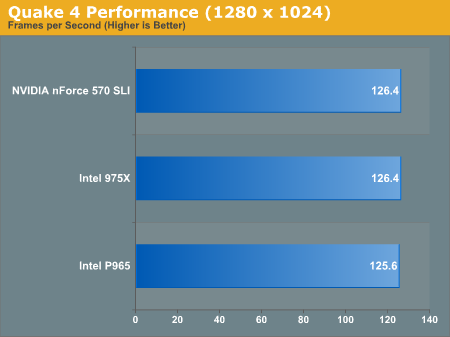
At 1280 x 1024 there's no longer a performance difference between the three platforms since we're very GPU bound, but let's see how power consumption changes.
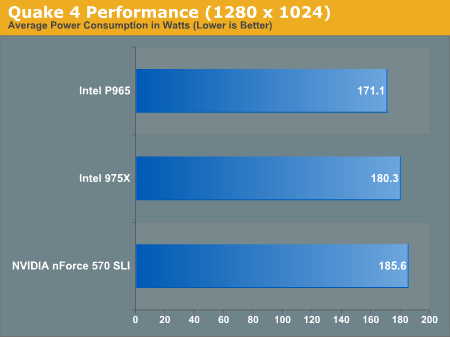
The gap between the P965 and nForce 570 SLI actually grows to 8.5%, and obviously giving the P965 the performance per watt crown.
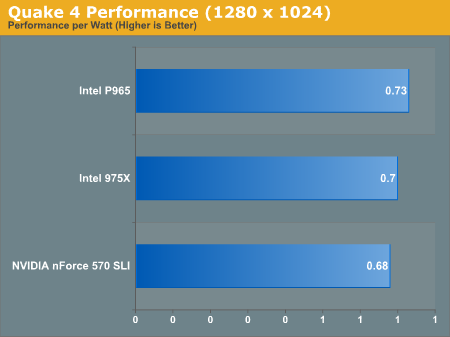
Let's look at a few other titles before coming to any conclusions though.
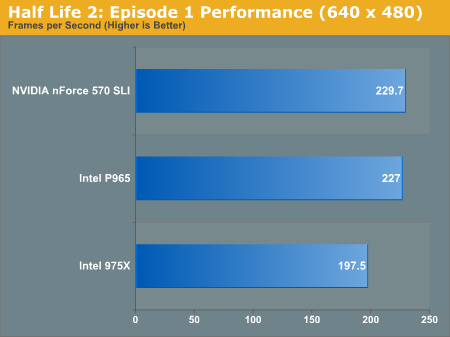
Gaming Performance & Power Usage with Half Life 2: Episode 1
For some reason the Intel 975X platform fell notably behind the P965 and nForce 570 SLI, which will surely hurt it in the performance per watt comparison.
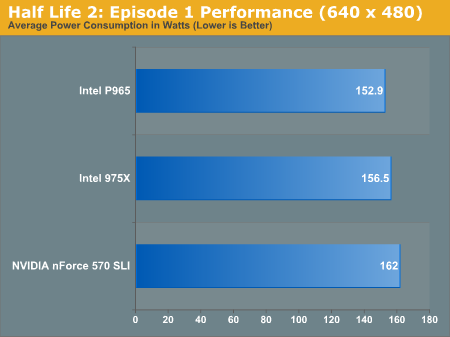
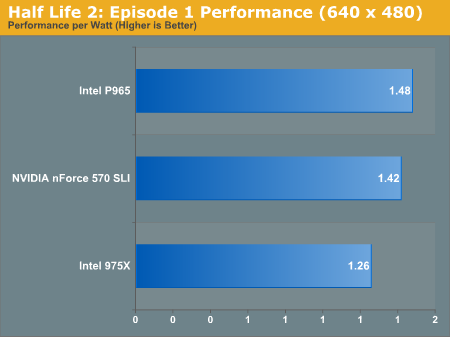
Power consumption is fairly consistant, with the nForce 570 SLI drawing 6% more power than the Intel P965 while offering similar performance. The performance per watt chart below summarizes that fact fairly succinctly:
As we crank up the resolution the performance gap narrows, making all three platforms virtually equal.
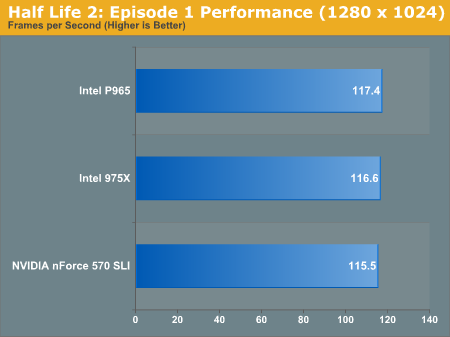
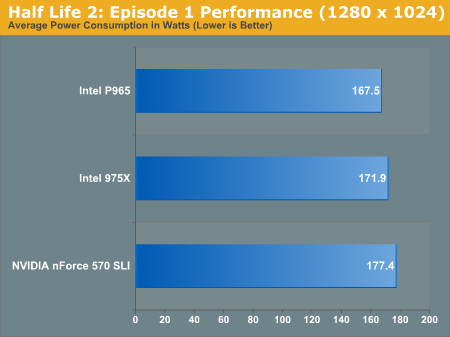
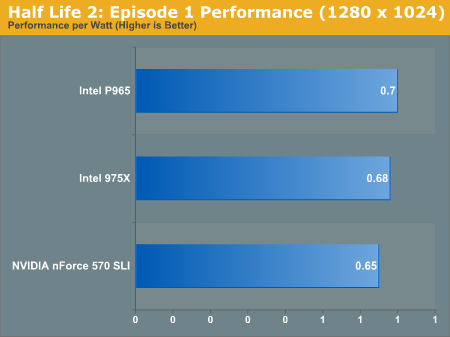
Power consumption actually stayed virtually unchanged with the 570 SLI drawing 5.9% more power than the P965.
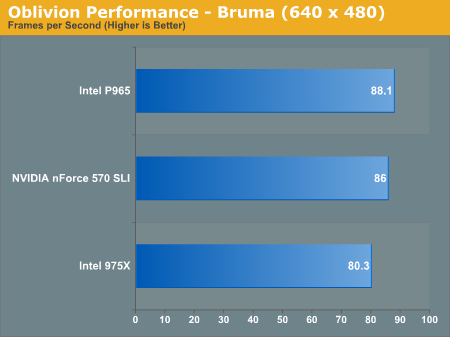
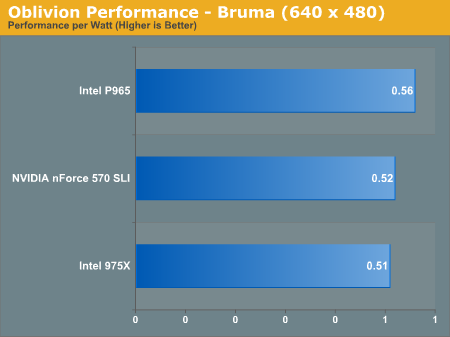
Gaming Performance & Power Usage with Oblivion
Once again we see unusually low performance from Intel's 975X chipset, while the P965 and nForce 570 SLI are virtually equals.
Power consumption is fairly similar to what we've seen in the past two benchmarks, with the 570 SLI pulling 5.8% more power than the P965.
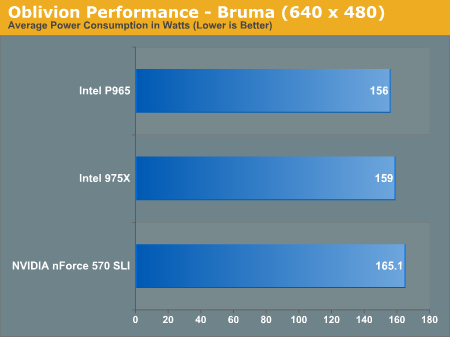
With better performance and lower power consumption, the Intel P965 continues to be the performance per watt king.
Turning up the resolution equalizes performance:
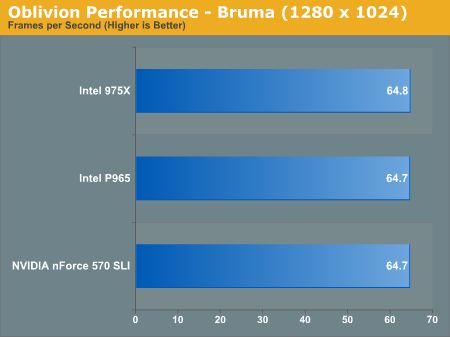

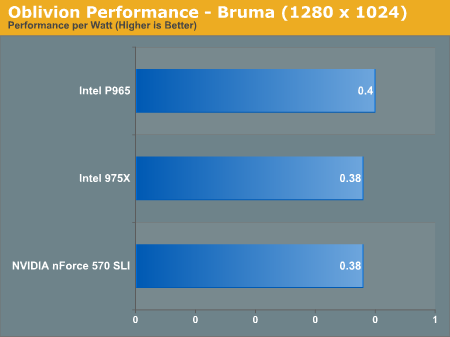
...while not doing much for the power consumption standings.
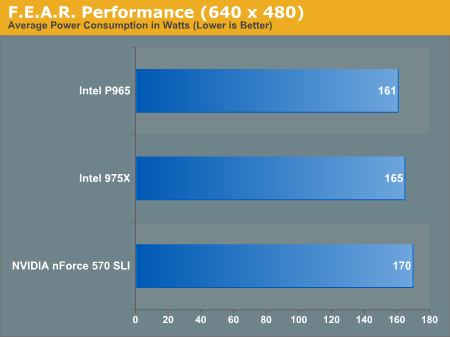
Gaming Performance & Power Usage with F.E.A.R.
At 640 x 480, Intel's flagship 975X manages to fall behind in performance while the remaining two platforms duke it out for the top spot.
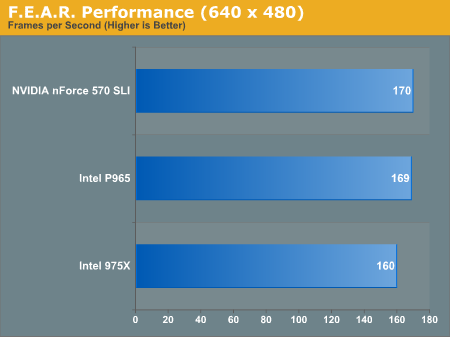
Power consumption is no different from the rest of our gaming tests:
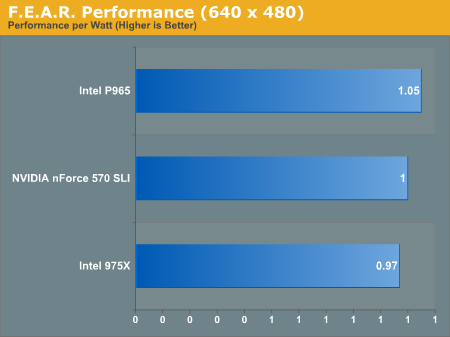
In the performance per watt category the P965 manages a 5% lead over the nForce 570 SLI, which comes in second thanks to the poor showing of the Intel 975X.
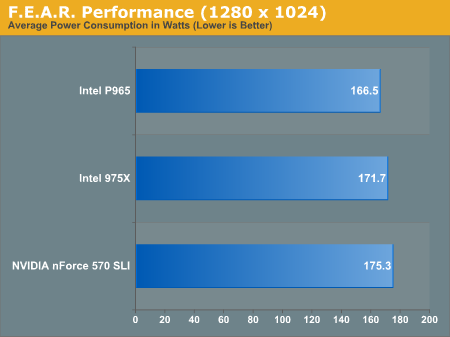
Performance is equal among all of the contenders at 1280 x 1024:

And the power consumption standings don't change much either:

Final Words
The table below summarizes the average power consumption among the three platforms in the four major categories of benchmarks we ran:
General Apps |
3D Rendering |
Encoding |
Gaming |
|
NVIDIA nForce 570 SLI |
137W |
148.6W |
149.9W |
166.3W |
Intel P965 |
127.3W |
142.1W |
142.9W |
157.0W |
Intel 975X |
131.1W |
144.7W |
146.6W |
160.7W |
Interestingly enough, the general application tests show the largest gap in power consumption between the chipsets. But all four categories agree that Intel's P965 chipset is your best bet when it comes to power consumption and as we've shown here, performance as well.
The power consumption aspect is obviously only one part of the decision to go with a particular chipset, and in the case of the nForce 570 SLI - support for NVIDIA's SLI technology is a major reason to opt for this chipset. If, however, you are like the majority of the population and don't plan on taking advantage of any multi-GPU solutions then support for SLI isn't too important. If your goal is simply good performance and lower power consumption, then the P965 brings you one step closer to attaining that goal.
For those interested in even lower power consumption there are two more options available: Merom Desktop solutions and AMD's Energy Efficient line of CPUs. We'll be looking at those next...


